Collateral Analytics introduces an automated solution to assist lenders, appraisal management companies and other users of appraisal services with TRID appraisal fees compliance
by Michael Sklarz, Ph.D., Stefan Pampulov, John Cirincione, SRA, CRE, FRICS & Darlene Swain
The TILA/RESPA Integrated Disclosure Rule (TRID) will be going into effect October 3, 2015. The new regulation will significantly affect Lenders, Appraisal Management Companies and Appraisers.
The new reform requires the loan estimate to be delivered to the borrower within three days of the application. To help lenders calculate the loan estimate more accurately, CA has developed a new solution that automatically identifies properties that are likely to be complex and therefore subject to higher appraiser fees associated with complex properties.
As we know, appraisal fees can vary by property type, value, location and property characteristics – to name a few. Under the new regulation, time is of the essence to get valuable information upfront to provide the most accurate loan estimate to the borrower within the three-day period. With the CA Complexity Profiler, the lender will be provided with a score instantaneously, before or at the time of application, to help determine if the appraisal fee should be adjusted based on the complexity of the property. This process will not only save time and money, but also limit potential customer service, client and vendor issues related to complex property appraisal assignments in this new environment.
Collateral Analytics’ Complexity Profiler quickly identifies the level of property complexity by calculating an objective score for each property. The Complexity Profiler analyzes the subject property characteristics and compares them to those of the surrounding market sales. The objective is to identify each property as being complex or non-complex and, thus, allow lenders and appraisers to predetermine the level of difficulty of appraising each property within seconds.
Some of the main outputs include:
• Designation of Complex vs Non-Complex Property
• Numerical Complexity Score
• Detail Property Information with access to Listing Information and public record data
• Interactive map of the subject property and comparable properties
• List of surrounding market comparable sales with access to detailed listing and public record data
• Market Condition analysis – Using the 1004 Market Condition Addendum indicators
• Market level charts with comparison of the subject property relative to all other sales
The property characteristics that are being investigated within the Complexity Profiler include:
• Living area square footage
• Land area
• Bedroom count
• Bathroom count
• Age of the home
• Property type
• Sold and List price per square foot
• Distance of the comparable properties to the subject property
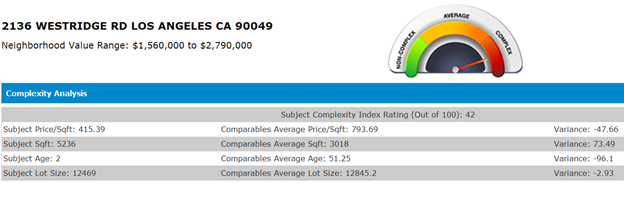
Figure 1 below displays the comparison between subject property characteristics and selected micro market neighborhood comparable properties. The analysis identifies each one of these as typical or atypical. Based on the individual variances, an overall complexity index score is calculated which ranges from 0 to 100 (most complex to least complex).
An objective way to define the real estate market also supports the complexity profiler. The market condition analyzes a number of individual and well-known market indicators which Collateral Analytics has been using for many years to predict the future direction of home prices. In fact, these include the same market indicators which appraisers are asked to use to complete the Market Condition Addendum in the standard 1004 Appraisal.
These series are the values and trends over the past 12 months for:
• Number of Sales
• Absorption Rate
• Number of Active Listings
• Months of Inventory Remaining
• Median Sold Price
• Median Sold Market Time
• Median Active Listing Price
• Median Listing Active Market Time
• Median Sold-To-List Price Ratio
• Number of Foreclosure Sales as a Percentage of Regular and REO Sales
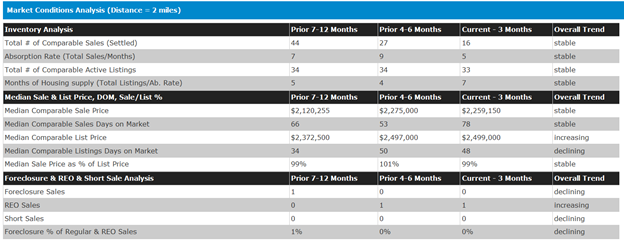
The magnitudes and trends of these 10 indicators are combined into a qualitative market ranking. Figure 2 below shows quarterly values of this market condition for a specific property and the surrounding neighborhood.
Determining the complexity of a property is important to the lending process which can impact the loan estimates. Implementing the Complexity Profiler product into the workflow process through XML integration with customized rules or manual entry basis by property address, provides instantaneous results and allows for adequate loan estimate appraisal fee allocation and risk reduction.
Download a PDF file of this research paper here.