Download a PDF file of this research paper here.
Introduction
Last year, we wrote a paper titled “Housing Market Softening at the Top End: Will the Bottom End Follow?”[1] In that discussion, we suggested that the high Months of Inventory Remaining (MRI) in selected markets would soon depress prices, as that is the only way to bring buyers and sellers into an equilibrium market. Among these markets we highlighted are condominiums in Miami Beach, where there is a great deal of excess inventory. What makes Miami Beach and Miami in general so interesting is that it is a relatively land constrained market with a very low ratio of useable land, and yet it is also a very elastic supply market in general, based upon very high density of development. [2] Density of development in markets like Chicago also help keep prices at more reasonable levels versus markets like San Diego where 30 foot height limits are common.
Here, we re-visit MRI, and again suggest that residential prices are quite predictable based on indicators of market condition, such as those used here. This follows a long line of research stretching back to the 1980’s where we have examined many useful technical and market-based indicators that lead real estate prices. Our market conditions indices include a number of variables, among these are months remaining inventory (MRI). See our prior paper referenced in footnote 1 for a more complete description of market condition indicators.
This is not to suggest that knowledge of future price trends is sufficient to make good real estate investment decisions, as transaction prices may be too high to exploit observed minor and sometimes short-term deviations from equilibrium and longer-term values. But knowledge of future price trends should allow for better investment timing and better mortgage investment decisions, where collateral price risk is known to be a major driver of default risk. Here we continue to demonstrate the correlation between leading indicators of price trends and those prices, with the caveat that one must be careful to not simply look at overall prices.
Miami Beach Condominiums Reacting to Over Supply
Miami Beach and the Miami Metro in general is a very land constrained market, where ocean on one side and wetlands on the other side minimize available land for development. But unlike most coastal markets, Miami allows high density of residential construction and this results in a very elastic supply despite the otherwise tight land area relative to population. During the easy credit years of 2005 and 2006 we observed a great deal of new condominium inventory in Miami Beach, followed by significant price dips. Many other markets also exhibited high supply with very high Months of Inventory Remaining in 2007 through 2011, and these markets also were hit by significant price declines.
What is different in recent years is that most U.S. markets have not experienced over building, showing more discipline than in the past, while Miami Beach has continued to optimistically add new supply affecting the existing condominium market. See Exhibit 1 below comparing a number of major condo markets over the 2005 through present time period. The top line is Miami-Miami Beach CBSA. In 2019 this CBSA continues to have more than triple the MRI as compared to other major markets shown. One explanation is that when most inventory is supplied in larger scale developments and via high rise buildings, it takes longer to plan and to build such buildings, leading to greater amplitude in the normal real estate cycles versus single family markets where developments are more granular and smaller scale. But observers of the market should have picked up that Miami Beach has had relative high inventories, not just in recent quarters but since 2016. Capital providers should have been aware of some of these red flags, unless the time required to plan such investments was more than three years. [3] To the extent the investors were not local, Miami may also have been a less informed market.[4] Market prices in Miami Beach are shown in Exhibit 2 for the overall markets and for several selected properties by price per square foot in Exhibit 3.
Exhibit 1: Condominium Inventories for Several Major US Markets

In Exhibit 2 we examine average condominium prices for Miami Beach without considering the mix of sizes, along with sales volume. Note that based on this graph alone, one may not observe that prices for similar units are actually declining after 2016. Adjusting for size provides a different picture.
In Exhibit 3 below we examine the average prices per square foot for several selected condominium projects. It is interesting to note that the above mix of transactions does not apparently affect overall average prices, based on what we observe in Exhibit 2. We see a high degree of variability, but the overall price trend appears to be fairly flat. However, Exhibit 3 reveals the misleading nature of examining only overall prices. Prices per square foot for individual buildings have been declining since the end of 2015 through at least the first part of 2019.
Exhibit 2: Overall Miami Beach Condominium Prices with Sales Volume

Exhibit 3: Miami Beach Condo Prices React to Inventory: Prices Per Square Foot
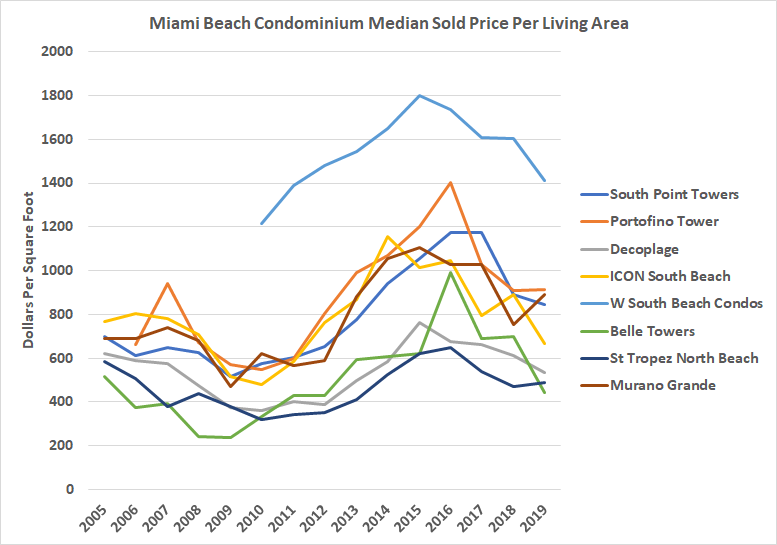
This is a great example of how data spinning may portray a market that seems stable versus one that is actually weakening, with prices in a number of condominium buildings down by approximately 25%. The average or median prices revealed in widely followed indices like Case-Schiller would not reveal this downward price trend.
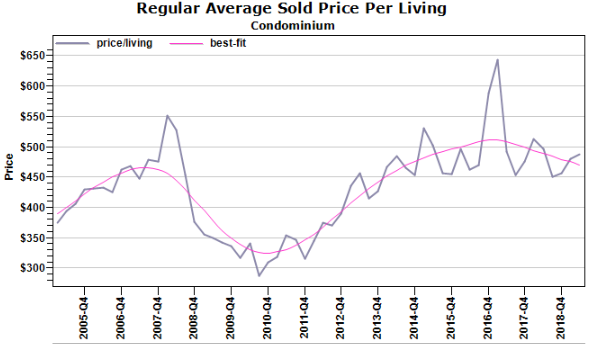
These declining price trends are shown as well in Exhibit 4 below, where all Miami Beach condos are included on a sold price per living area basis. Here it appears the prices have been declining since the end of 2016.
Exhibit 4: Miami Beach Condominium Sales Per Square Foot with Fitted Trend
Greater market nuances can be picked up by examining the market conditions by price range. As we showed in previous discussions, the greatest increases in inventories in Miami Beach are those for markets where the average prices exceed $750,000. In this range of $750,000 to $1,000,000, prices should continue to soften for a while as inventories remain unusually high.
Conclusions
Observers and pundits of the housing market must have a sense of history and what is normal for local markets, property type and for various price tiers. Only then can they really know if market conditions are changing. Once we understand what is normal, we can make better predictions.
When we see unusually high MRI’s, compared to history and qualified for the appropriate price range, prices will usually soften in the following quarters. Price declines help absorb inventory faster which then leads to declining MRIs. While most US markets are in good shape with regard to supply and demand as of the early summer 2019, those average priced markets where the average MRI exceeds 10 months are much more likely to soften. Our reliance on indicators like average prices does not pick up the reality behind markets like Miami Beach. But price per square foot does portray the actual situation that prices in Miami Beach have been softening for several years and will continue to soften, as we continue to observe excess inventory. This is especially true for the $750,000 plus price tiers.[5]
[1] See https://www.collateralanalytics.com/blog/2018/10/24/housing-market-softening-at-the-top-end-will-the-bottom-end-follow/
[2] See https://www.naahq.org/news-publications/barriers-apartment-construction-index which includes several markets and relative indices of land availability.
[3] In severe supply constrained markets like San Diego this is often the case that a development is feasible when planned but when it takes several years for approvals, market conditions may have changed.
[4] South Florida has attracted a great deal of foreign capital over the years, with Canada dominating as buyers, but with development funding coming from Argentina and Brazil, looking for safe havens and being able to relate to a Latino friendly market. See “northern Exposure” In the Real Deal, South Florida News, Sept. 20, 2018 at https://therealdeal.com/miami/issues_articles/northern-exposure/
[5] Collateral Analytics provides a number of tools to examine markets on both a macro and micro basis and, with more sophisticated information analytics, there should be fewer surprises for lenders, homebuyers, investors, and developers.