by Dr. Michael Sklarz* and Dr. Norman Miller** | October 24, 2018
Download a PDF file of this research paper here.
Introduction
Some housing market observers have noticed that higher priced homes, on average, are taking much longer to sell than median priced homes in a number of the nation’s real estate markets. This is not new, nor is it unusual. Perhaps the availability of such data is new to some market observers, but we have tracked Months Remaining Inventory, MRI, for a long time and here we put it into context as one of the many leading indicators of housing price trends that we have examined many times in our prior research.
Leading Indicators of Housing Price Trends
For more than three decades we have been collecting data and studying leading indicators of the housing market. There are several fundamental drivers of housing markets, no matter how micro the analysis, such as household growth rates, employment trends and interest rates driving the demand side. On the supply side we can track the elasticity of supply, the rate of permits and new construction trends. For example, right now, in the fall of 2018, we know that mortgage rate increases will follow the recent ten-year treasury rate increases and in turn this will affect affordability on the demand side. In a few quarters, the sellers will start to adjust to this reduced affordability and prices that have been climbing may stabilize or even decline in the more elastic markets. We also know that the lower priced tiers are more sensitive to interest rate increases than the upper priced tiers. For examples of some of this research see the references listed at the end dealing with interest rates, employment and other drivers of market conditions.
Forecasting shorter term trends, those which affect the housing market in less than a year, and turning points in prices are the focus of a number of market condition indicators that we track. These include but are not limited to sales volume, average time or days on the market, sale price to list price ratios, the percentage of listings that expire without a sale or the percentage that adjust list prices downward, the rate of foreclosures and distressed sales, the turnover rate in the market, and many more.
Among these, one of the best short-term indicators is Months Remaining Inventory. Based on the recent rate of sales we estimate how long it would take to exhaust the current inventory of homes for sale, if sales continue at their recent rate. This can be calculated for the market as a whole in any given geography, by property type, by price range or on average for a given geography. Based on history, we can generally describe market conditions as a function of MRI as follows:
Strong to hot: MRI < 3 months
Good: MRI < 6 months
Normal: MRI = 6 to 9 months
Soft: MRI = 9 to 24 months
Distressed: MRI > 24 months
However, these generalizations should be qualified. For the lower priced tiers, the bottom 1/3rd of the price range, the normal MRI runs a little faster and a strong market would be MRI<2 months, and at the top end for the highest price tier, say above 1.25 million dollars, although this varies by market, the normal MRI is slower and 12 months or even a little longer, would be fairly normal. With the caveat that lower priced tiers run lower MRI and higher priced tiers run higher MRI in equilibrium, we provide some examples below to illustrate how MRI varies over time and currently. We also show a few markets where current MRIs are running high, although we want to point out that most of the US housing markets are quite normal and healthy.
Months Remaining Inventory as a Short to Intermediate Indicator of Market Conditions
As stated above, Months Remaining Inventory, MRI, is an excellent indicator of market condition in the housing market. When MRI is relatively low, it is typically a healthy and active market. In some cases, low MRIs suggest what some call a “sellers’ market” with properties selling very quickly and prices on the rise. MRI trends do foretell price trends. Below in Exhibits 1 and 2 we show a few longer-term trends where we segment MRI by price range. In Exhibit 1 we observe Phoenix, a market hit very hard in 2008 by the housing meltdown. We show five price segments and we observe the normal pattern where higher priced tiers require a longer time to sell, on average. Note that in 2008 the lowest price range of LT250, less than $250,000, suddenly had over 16 months of unsold inventory. For the lowest price tier, this was unusual and price declines followed in the quarters that followed. What we see today is fairly normal, with MRI typically in the 3 to 4-month range, and slightly higher MRI for the top price tiers, but still not outside of the normal ranges.
Exhibit 1: Phoenix (Maricopa County) MRI over time by price range

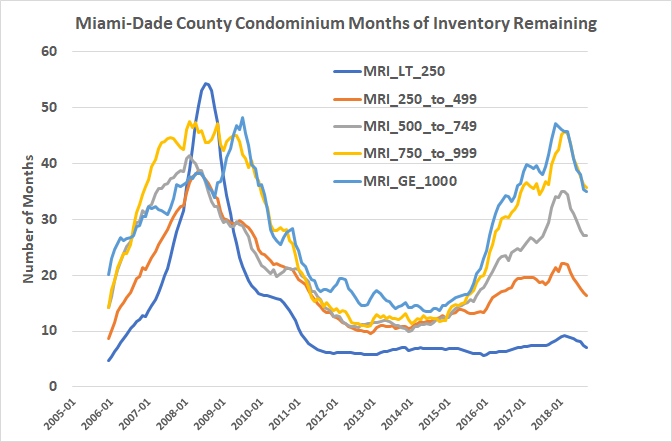
In Exhibit 2 below we show the same price tier time series for Miami (Dade County) but restricted to condominiums and we note again that the lowest price tiers did take a hit with higher MRI in 2008. The scale now goes only to 60 months versus the 45 months for Maricopa and the results are similar to Phoenix single family, until the last three years. Note the much higher MRI for the upper price ranges with nearly four years of inventory for the highest price ranges in 2017.
Exhibit 2: Miami-Dade County MRI over time by price range
Recent Softening of Market Conditions
In the past several months we have seen a softening of the top end of the housing market. By the top end, we mean the upper 25% or so of the price range in most markets. At the same time, the price tier most sensitive to the recent mortgage rate increases is the bottom 25% of the market, especially the bottom 25% where FHA and VA financing is more common. This suggests a softer and slower resale market as we enter 2019. In markets with significant new building over the past few years, inventories have increased and our single best indicator for overall market conditions, MRI have been increasing. Metro or CBSA prices have not yet fallen, with some exceptions, but some price flattening should be expected soon and we have already seen flattening in some select neighborhoods or zip codes. We also observe an abundance of price drops on existing listings in select neighborhoods, which tends to precede price declines.
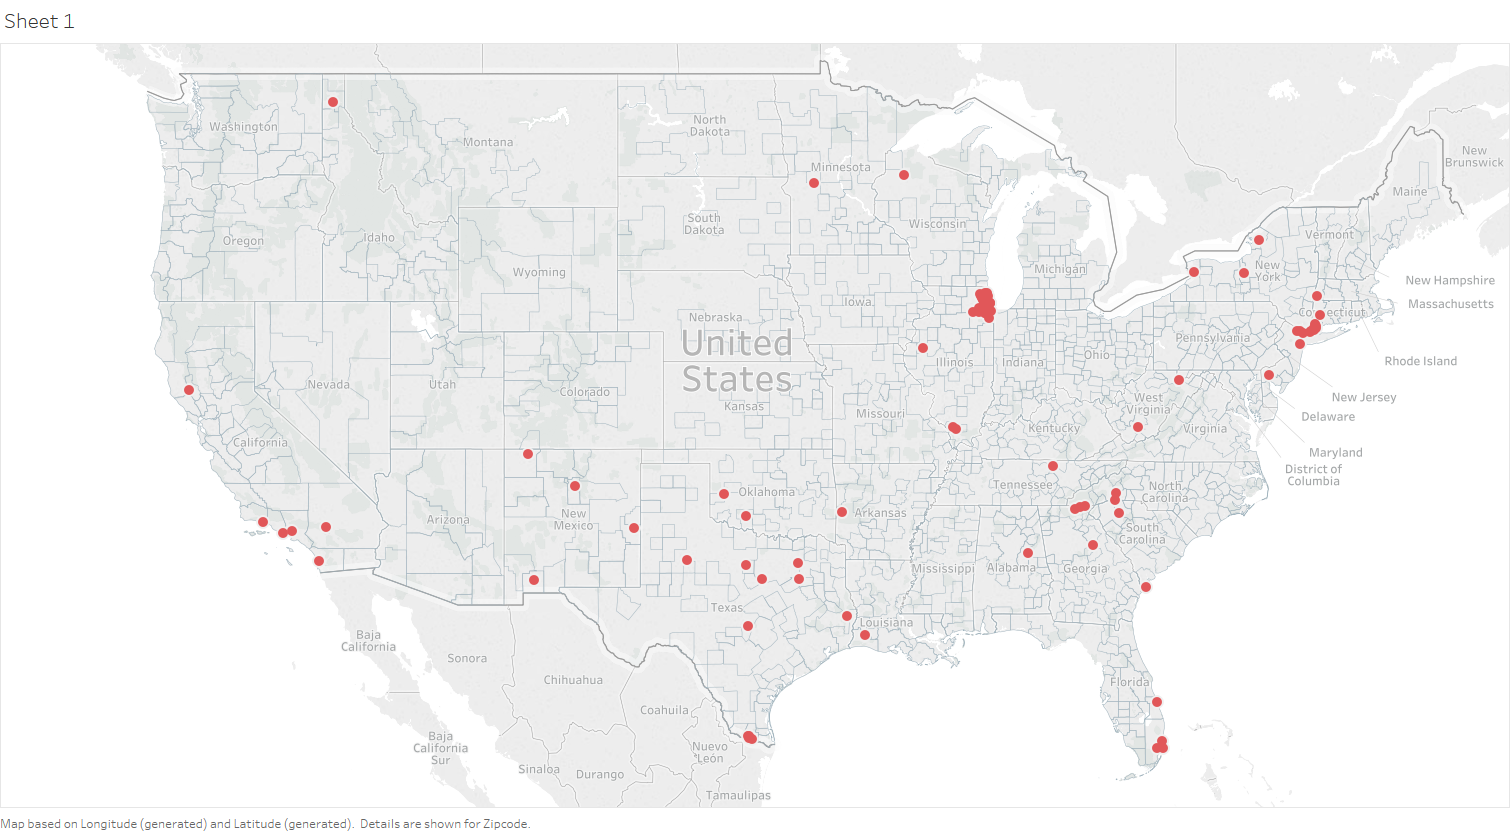
Below in Exhibit 3 are those zip codes where the average MRI exceeds 10. 10 months of inventory is considered fairly large and typical of softer markets. Again, higher priced segments often exceed 12 months of inventory but rarely do lower and averaged price tiers. We notice a few clusters of these weaker markets near Chicago and in the Miami area of Florida.
Exhibit 3: Zip codes with Average MRI >10 months
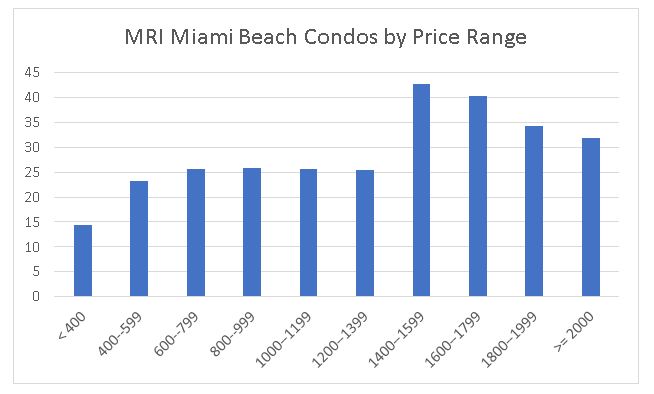
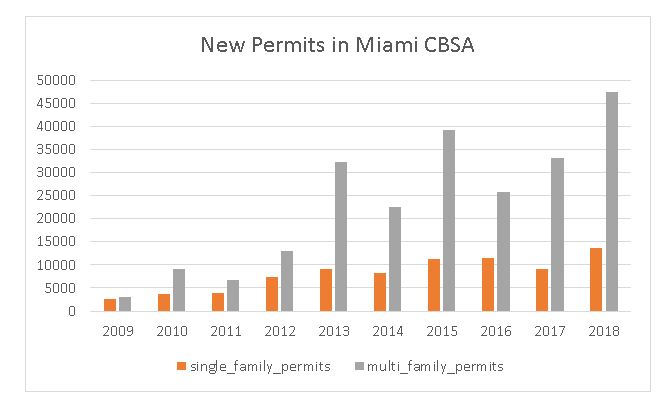
Miami Beach, a sub market of Miami-Dade County, reveals very high MRIs across the board at nearly all price points. So much inventory has been added that it is affecting resales and the high MRI suggests a few years of softer prices. See Exhibit 4A and 4B below. Exhibit 4B includes the Miami CBSA but it is indicative of the relatively large increases in supply in recent years.
Exhibit 4A and 4B: Miami Beach Condos Affected by Too Much New Building
In most other cases, we observe soft markets, not based on adding too much new supply, but rather because of softness in the local economic base. This seems to be the case in the Northeast Illinois markets including Palatine, Mount Prospect, Northbrook and Zip Code 60646 in Chicago. A few of these are shown below. For example, we show Palatine, Il, MRI in Exhibit 5A and then the price and volume for Palatine in 5B. Notice that Palatine has never really recovered from the market peak in 2006-2007 with the current high MRI levels suggesting that this will continue for the near term.
Exhibit 5A: Palatine IL MRIs Are Quite High

Exhibit 5B: Palatine IL Single Family Prices Should Continue to Trend Sideways

For another examples, consider Mt. Prospect, also in Northeast Illinois, where MRIs are running high. Here prices had rebounded somewhat from their 2010-2011 troughs, but recently have dropped with lower sales volumes.
Exhibit 6A: Mt. Prospect IL MRIs Are Quite High
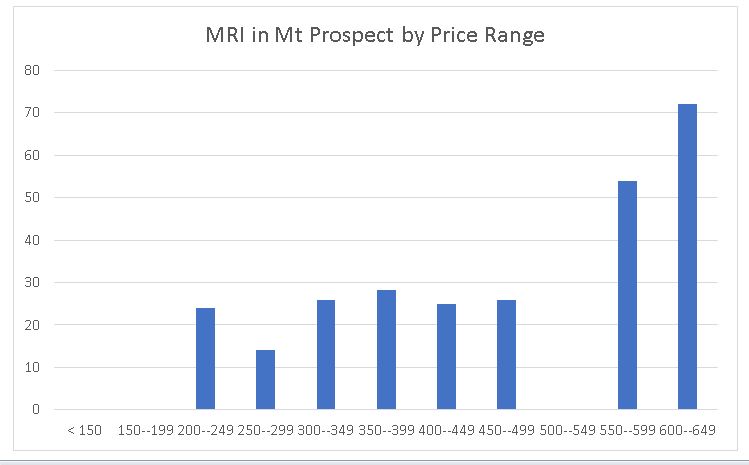
Exhibit 6B: Mt. Prospect IL Single Family Prices Should Continue to Trend Sideways

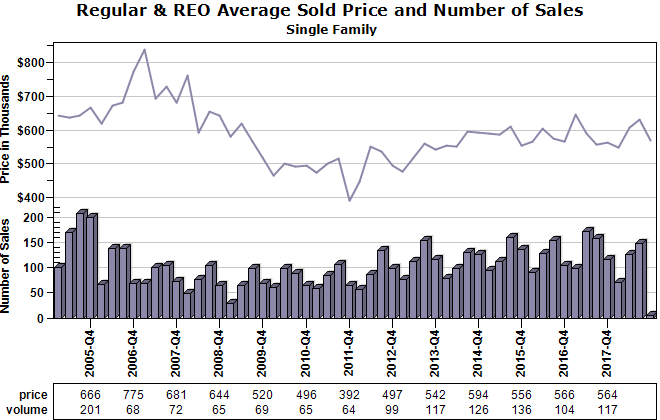
Also, in the same general region, we observe high MRIs in Northbrook, in Exhibit 7A. Prices have not yet dropped, as we see in Exhibit 7B but are very likely to continue their flat trajectory of the past several years.
Exhibit 7A: Northbrook IL MRIs Are Quite High
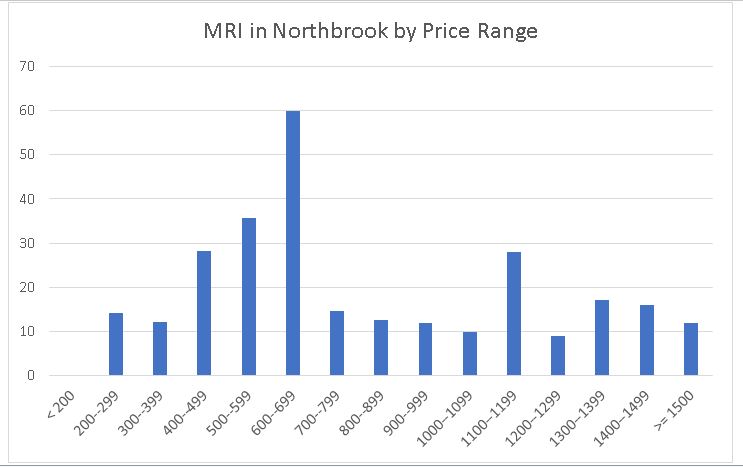
Exhibit 7B: Northbrook IL Single Family Prices Should Continue to Trend Sideways
For our last example, we return to Miami, this time focused on Miami Beach condominiums, and here again we observe very high MRIs in Exhibit 8A. In Exhibit 8B we observe a stubborn set of sellers now facing a lot of competition. Prices have not yet dropped but will likely decline soon.
Exhibit 8A: Miami Beach Condominium MRIs Point To Significant Softness in Upper Price Tiers
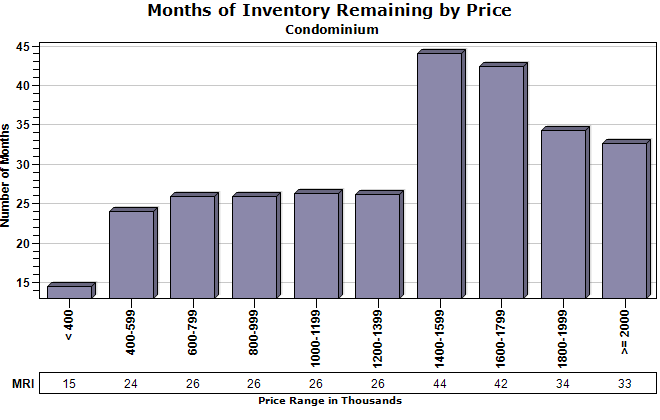
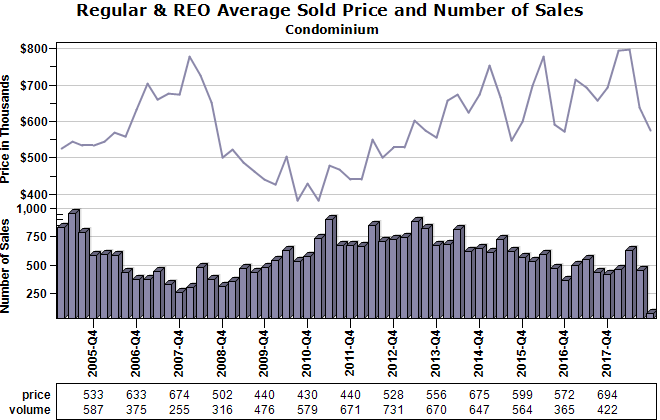
Exhibit 8B: Miami Beach Condominium Price Have Been Flat Over The Past Several Years But Will Likely Soften Soon
Conclusions
Observers and pundits of the housing market must have a sense of history and what is normal for local markets, property type and for various price tiers. Only then can they really know if market conditions are changing. Once we understand what is normal we can make better predictions, but high MRIs for high-priced home tiers is not that unusual and few US markets are exhibiting anything that should alarm sellers as of the fall, 2018.
When we see unusually high MRI’s, compared to history and qualified for the appropriate price range, prices will usually soften in the following quarters. Price declines help absorb inventory faster and then we will observe the MRIs declining. While most US markets are in good shape, as of the mid-fall in 2018, with solid market conditions, those average priced markets where the average MRI exceeds 10 are much more likely to soften. We provided a few examples here of such markets, like Miami Beach condominiums.
There are two reasons why we observe higher than normal MRIs. The first is from too much supply hitting the market, as we observe in Miami Beach. The second is from a weaker local economy, which is more the case in Northeast Illinois markets shown above. Both of these factors can be picked up by monitoring MRI and knowing what is historically normal. Collateral Analytics provides such housing market trend and market indicator data to their clients for ongoing monitoring of macro and micro market conditions and to help them identify important turning points in these markets.
References
References of Prior Academic Research on Leading Indicators of the Housing Market
Miller, Norm and Michael Sklarz, “Integrating Real Estate Market Based Indicators into Fundamental Home Price Forecasting Systems” Journal of Housing Research, Vol. 21, No. 2, pp.183-215, 2012.
Miller, Norm with Liang Peng and Michael Sklarz,”House Prices and Economic Growth” the Journal of Real Estate Finance and Economics, Vol. 42, No. 4, 2011, pp 522-541..
Miller, Norm with Liang Peng and Michael Sklarz “The Economic Impact of Anticipated House Price Changes – Evidence from Home Sales”, Real Estate Economics, Vol. 39, No. 2, 2011
Miller, Norm with Jim Clayton, and Liang Peng “Price Volume Correlation in the Housing Market: Causality and Co-movements”, Journal of Real Estate Finance and Economics, 40, No. 1, pp. 14-40, 2010
Miller, Norm with Michael Sklarz and Tom Thibodeau “The Impact of Interest Rates and Employment on Housing Prices” International Real Estate Review, Vol.8, No. 1: pp 26-42. 2005
Miller, Norm with Michael Sklarz “Leading Indicators of Housing Market Price Trends,” The Journal of Real Estate Research, Fall, 1986.