by Dr. Michael Sklarz and Dr. Norman Miller | October 01, 2018
Download a PDF file of this research paper here.
Introduction
Waterfront sites provide unspoiled views, access to recreation and fishing, and cleaner air. In recent years we have witnessed increased risks from weather induced floods, especially in low lying geographies. Tests of waterfront premiums for the nation as a whole in the year 2018 indicate that waterfront does have a substantial premium but that it varies by the type of water (ocean, lake or river). In Part 1 of this white paper on waterfront proximity we established that the average US premiums for oceanfront, lakes and rivers were approximately 45%, 25% and 20% respectively for waterfront property, where we defined waterfront property as right next to water. In that study of some 1.2 million waterfront properties were compared to several million within the same zip code, with controls for differences in size, age and features as well as location. We also note that waterfront nearness and impact on value varied by local climate, size and other qualities of the water. Some of the highest premiums are observed on the US west coast based on the temperature dampening benefits of being near the coast, with such benefits extending several miles inland.
In addition to the positive net premiums observed for waterfront property, there are risks associated with being on the waterfront. The primary risks are flooding and property damage from storms, and in the longer run, from rising sea levels. Here we examine market reactions from the 2017 hurricanes, Irma and Harvey, and then use elevation data to focus on one metro market, San Francisco, to examine the value effects from lying close to sea level.
Background
Several studies have now focused on the impact and awareness of being in a location with a high risk of flooding. For example, much of the Sacramento-San Joaquin Delta of California is below sea level, but the area is not considered a floodplain because of the levee system (designed to withstand a 100-year flood). As a result, residents are not informed that they are at risk from floods or purchasing a home in a floodplain.[1] Jessica Ludy and G. Matt Kondolf (2012) studied this region and assessed the resident’s awareness of flood risk.
The authors concluded that most residents did not understand the risks of being flooded. Another interpretation of the survey is that households rely on the federal and state governments to restrict development in locations and that these are trusted sources of information on flood risks. If you are allowed to build, the logic implied is that, it must not be too dangerous.
A severe flood event may provide information to the market about the risks of flooding and create enough awareness to generate price discounts, by changing the characteristics or perceptions of flooding risk of the marginal buyer. Okmyung Bin and Craig E. Landry (2012) study Pitt County, North Carolina, using multiple storm events within a difference-in-differences framework, and compare flood zone price differentials for a more recent sample of property sales. Prior to Hurricane Fran in 1996, they detect no market risk premium for a home being in a flood zone, but find significant price differentials after major flooding events, amounting to a 5.7% decrease after Hurricane Fran and 8.8% decrease after Hurricane Floyd, but this negative effect on the premium diminishes over time, essentially disappearing about 5 or 6 years after each event. They conclude the lack of a persistent effect suggests that buyers’ and sellers’ risk perceptions may change with the prevalence of hazard events and that homebuyers seem unaware of flood risks and insurance requirements.
Francesc Ortega and Suleyman Taspinar (2016) examine the effects of Hurricane Sandy on property values. They assembled a large plot-level dataset with rich geographic data on housing sales in New York City for the period 2003-2015, along with information on which building structures were damaged by hurricane Sandy, and to what degree. The average negative impact was approximately 13%. These effects were also found for houses that were not damaged but are now perceived to be at high risk of coastal flooding. The reductions in value could, as the authors note, alternatively been caused by increases in flood insurance premiums.
However, it is often the case that households in locations with chances of flooding do not purchase flood insurance. For example, in the poorest areas of Texas, hit by Hurricane Harvey in the summer of 2017, few residents had flood insurance.
“I wish I had flood insurance now,” lamented Leroy Moore, a 58-year-old whose home in Northeast Houston filled with water. He cancelled his flood policy when it grew too expensive. He and his wife were rescued from the rising waters on Sunday by National Guard troops and are now sleeping in a church. “When it’s a choice to make between things and life, sometimes you’ve just got to let the things go and hang on to life.”[2]
Regular home insurance covers wind damage but not flooding. Only 17 percent of homeowners in the eight counties most directly affected by Harvey had flood insurance, according to a Washington Post analysis of Federal Emergency Management Agency (FEMA) data. While homeowners with a mortgage are required to purchase separate flood insurance policies, the cost of the insurance may be prohibitive for low income families. For example, in Texas, the average cost for a NFIP (National Flood Insurance Program) plan is $500 a year, but it can rise to more than $2,000 for homes inside a floodplain.[3]
Bernstein, Gustafson and Lewis (2017) have run the most exhaustive study to date on the potential effects of sea level rise. They use data from NOAA to map all the U.S. coasts for sea level rise risks. They conclude that current sophisticated buyers are becoming concerned about sea level rise and are discounting low lying properties by approximately 7% compared to similar equal distant but less exposed properties. They further break affected properties into exposure buckets, with properties that will experience ocean encroachment after 1 foot of global average sea level rise trading at a 22% discount, 2-3 feet at a 17% discount, 4-5 feet at a 9% discount and 6 feet at a 6% discount. They find no rental discounts and this makes sense given the shorter-term horizon of renters and lower wealth exposure.
The primary challenge for any estimate of the cost (capitalization of flooding risk into the value of the property) of flooding is to remove unobserved selection or sorting of type of owners, property quality, or neighborhood quality that is correlated with the risk of partial or catastrophic flooding. Unobserved factors could bias the coefficient estimate up or down. For example, consider two buildings next to each other (same view and location qualities) in the same neighborhood on the waterfront. One building is 15 feet above current sea levels and the second neighboring building is 1 foot above sea level. The original buildings were constructed and sold in the 1970s in the same year and are otherwise identical. The building on the 15 foot above sea level lot has had interior renovations multiple times and the building on the 1 foot lot has never been updated to current standards because of a fear of flooding. As a result, the building on the 1 foot lot is much lower in quality. When this property sells the econometrician will find a large discount for the 1 foot elevation building. This “flooding discount” will reflect the role of the elevation (flooding risk) and the unobserved building quality deterioration. As a result, the capitalization of the flooding risk will be overestimated.
Therefore, any estimate of waterfront premiums must control for the quality of the building, the attributes of the building, and the attributes of the location. Bernstein, Gustfson and Lewis (2017) approached this problem by using extensive location controls but with only a few attributes of the building (number of bedroom, square feet and age of the building) and no measures of quality.
Florence hit North Carolina in September of 2018, but there is not enough history to track any home pride trends. We do, however, have some history for Harvey and Irma from 2017.
Market Results from Harvey and Irma in 2017
Category 4 hurricane Harvey hit Texas August 25th of 2017. Rockport, Texas got hit head on and Houston also received a fair amount of damage. Harvey caused $125 billion in property damage in Texas according to the National Hurricane Center. Significant federal relief, also in the range of $125 billion was provided soon after the storm.[5] Approximately, 204,000 homes were damaged and 738,000 people asked for help from the federal government.
Irma was also a category 4 hurricane and she hit Florida August 30th of 2017, costing some 70 billion in property damage, along with significant dampening of tourist visitors for the following few months.[6] Although tourist demand was totally normal one year later. Among those markets hit hardest was Key West where there was no place to escape, aside from leaving the island entirely and heading north before the storm arrived.[7]
Harvey hit Texas in late August, and we see the volume of sales dropped to nearly zero in September, perhaps with some sales delayed. Sales volume remained below normal for several months but has since rebounded as seen in Exhibit 1. In Exhibit 2, we see that prices dipped more than seasonally normal in early 2018, both on a sales price basis and on a price per square foot basis. While prices remain a little lower than before Harvey, they have rebounded perhaps influenced by insurance rebuilding and funds brought into the market. There appears to be little permanent impact and it is surprising how resilient the market.
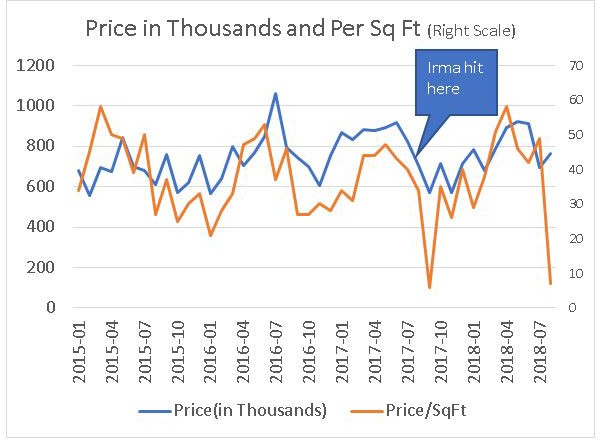
Irma also hitting Key West in late August, resulted in few sales in September of 2017, as shown in Exhibit 3, however, sales volume returned to nearly normal fairly quickly. Overall sales prices dipped in September, but for very few sales, and have rebounded since, although the price per square foot seems to be running just a little lower than before as seen in Exhibit 4. These comparisons are not from markets deep enough to offset variations in the quality and features included in the mix of sales, so any conclusions are questionable. It does seem though that because of insurance and a general optimism on the part of some buyers, that little permanent fears or price effects remain in these two markets hit head on by major storms.
Exhibit 1: Rockpoint, TX Sales Volume Over Time
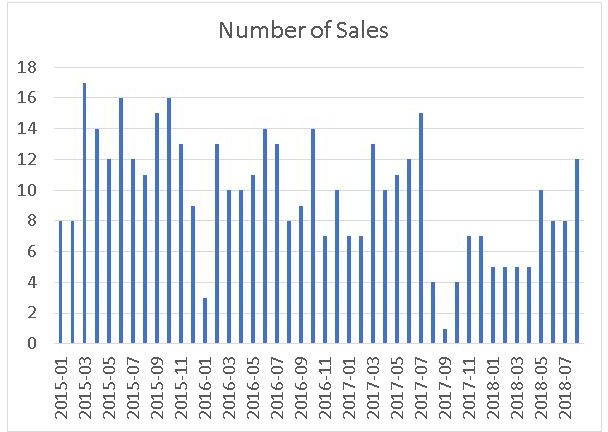
Exhibit 2: Rockport TX Sales Prices and Sales Price Per Square Foot Over Time
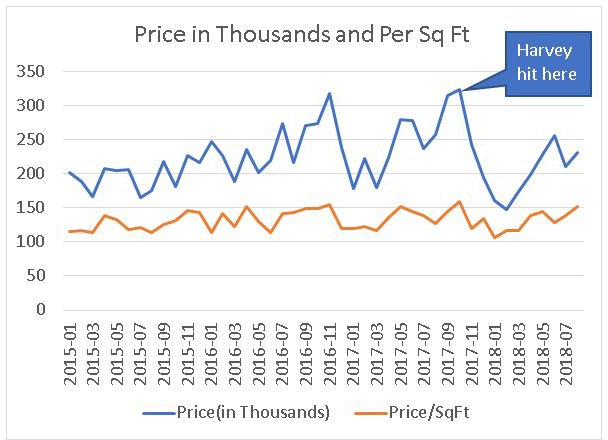
Exhibit 3: Key West, FL Sales Volume Over Time
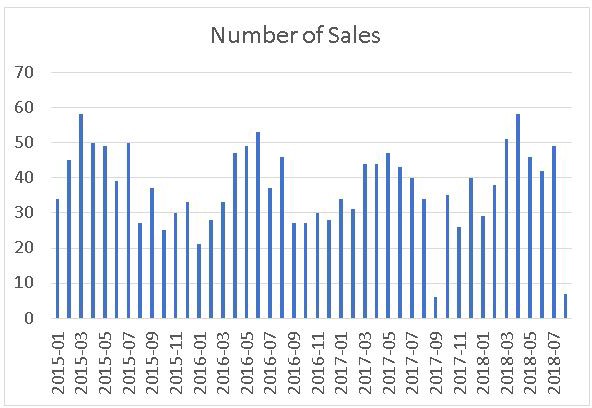
Exhibit 4: Key West Sales Prices and Sales Price Per Square Foot Over Time
Investors reaped the benefits of short-term distress from Harvey, and possibly many other such storms.[8] Brian Spitz, a local investor and president of Big State Home Buyers, has bought thousands of homes over the years, suggests that investors know how the system of Federal support and insurance works.
Hurricane Harvey was the most destructive storm in Houston’s history. The late-August storm dumped up to 60 inches of rain on southeast Texas, but the resulting damage was multiplied by actions taken – and not taken – during the past 50 years. The national flood insurance program encourages home owners to build, be flooded and rebuild according to David Hunn.[9] What these investors may also know is the cost to repair homes and how fast a well insured or protected market will rebound.
Data for a New More Rigorous Test In San Francisco
Separating the positive from the negative: We attempt to disentangle the discount associated with being at risk of flooding and sea level rises from the positive amenity of having a waterfront lot in a larger market. The data here includes 10,720 residential single-family home observations in zip codes touching waterfront, from the San Francisco metro area where data on elevation and nearness to water was available, along with the variables required to control for other influences on value. Again, the entire sample is selected only from zip codes touching the waterfront including the inland bay. These sales occurred from January of 2012 through the end of third quarter 2017, with dummy variables used for each quarter over that time span. This time we define waterfront more broadly as within 100 meters of the average high-tide water line. This results in more sites being defined as waterfront and lowers the expected premium compared to being immediately adjacent to waterfront when compared to nearby homes.
Results for San Francisco
For San Francisco, using only single-family residential homes we find near waterfront premiums of 6% to 9% for those homes within 100 meters of water compared to those not within 100 meters of the water but still within the same zip code. By using only homes in the same zip code we probably account for some of the quality bias, that is, most neighborhoods near water are already expensive high-quality homes. We control for other influences on value through the use of a hedonic pricing model that includes age, size and other features of the home. We control for price trends and only use sales from 2012 through 2017. To focus on flood risk, we include a variable for being within one, two or three meters of sea level. The effect of being at these elevations is a negative impact on value of from approximately -5% to -6%.
The results make intuitive sense. Access to waterfront has a positive influence on price, even compared to properties in the same zip code, but those in low elevations, subject to flood risks, exhibit an offsetting negative impact on value. Whether these negative influences have increased over time is not yet known, or whether this metro market is similar to others. Our results are similar to Bernstein, Gustafson and Lewis (2017) for the one and two-meter effects.[10]
Conclusions
Results here bear out some evidence of market price discounts in higher risk, more flood prone locations, not subject to recent storms. However, in markets hit hard by storms, price discounts seem to dissipate quickly and either the new wave of buyers forgets the risks or insurance proceeds mitigate the value impact. The Federal flood Insurance programs have clearly been underpriced based on the huge deficit accumulating over the past several years, and this has resulted in artificially propping up housing markets in flood zones, correctly identified in some cases but often not, by out dated maps.[11] We cannot confirm yet, that the market recognizes and discounts property value in line with flood risks along the coasts, despite such results observed by climate scientists in other studies.
References
Bakkensen, Laura and Lint Barrage, “Flood Risk Belief Heterogeneity and Coastal Home Price Dynamics: Going Under Water?” NABE paper #23954, Sept. 14, 2017.
Benson, Earl D., Hansen, Julia L., Schwartz Jr., Arthur L., Smersh, Greg T. (1998) “Pricing Residential Amenities: The Value of a View.” Journal of Real Estate Finance and Economics, 16:1, pp. 55–73.
Bin, Okmyung and Jamie Brown Kruse, “Real Estate Market Response to Coastal Flood Hazards” Natural Hazards Review, 7:1, Nov. 2006
Bin, Okmyung and Craig Landry, (2012), “Changes in implicit flood risk premiums: Empirical evidence from the housing market”, Journal of Environmental Economics and Management, 65:3, pp. 361-376.
Conroy, Stephen J. and Jennifer Milosch, “An Estimation of the Coastal Premium for Residential Housing Prices in San Diego County.” The Journal of Real Estate Finance and Economics, 42:2, pp. 211–228, 2011.
Ludy, Jessica and Matt Kondoff, (2012) “Flood risk perception in lands “protected” by 100-year levees”, Natural Hazards, 61:2. Pp. 829-842.
Ortega, Francesc and Suleyman Taspinar (11-2016) “ Rising Sea Levels and Sinking Property Values: The Effects of Hurricane Sandy on New York’s Housing Market” No 10374, IZA Discussion Papers from Institute for the Study of Labor (IZA) http://ftp.iza.org/dp10374.pdf
Plattner, R. H., and T. J. Campbell. (1978). “A Study of the Effect of Water View on Site Value,” Appraisal Journal 46 (January), 20–25.
Rinehart, J. R. and J. J. Pompe, “Adjusting the Market Value of Coastal Property for Beach Quality,” The Appraisal Journal (October 1994): 604-608.
Rodriguez, M., and C. F. Sirmans. (1994). “Quantifying the Value of a View in Single-Family Housing Markets,” Appraisal Journal 62 (October), 600–603.
Turnbull, Geoffrey K., Velma Zahirovic‐Herbert, and Chris Mothorpe (2013). Flooding and Liquidity on the Bayou: The Capitalization of Flood Risk into House Value and Ease‐of‐Sale. Real Estate Economics, 41(1), 103-129.
Udechukwu, C.E. (2010), “The Impact of Lagoon Water Views on Residential Property Values in Nigeria”, Lagos Journal of Environmental Studies, 2:2, 34-45.
Footnotes
[1] The National Flood Insurance Program (NFIP) requires owners of property with mortgages within the 100 year flood zones (1 percent chance of flooding) to purchase federal flood insurance. The federal protection against flood risks assists flooded owners in rebuilding homes that have sometimes been flooded before. The cost of the flood insurance is clearly below any market determined rates as evidenced by the increasing losses at the NFIP which is now about $25 billion in debt (Source: Government Accountability Office, NFIP debt). Some beneficiaries of NFIP have flooded many times, as described by this Bloomberg headline, “Love of Coastal Living is Draining U.S. Disaster Funds … About 400 miles east of Houston, off the coast of Alabama, Dauphin Island was spared the initial impact of Hurricane Harvey. Yet this tiny sliver of land near the mouth of Mobile Bay is just as important as the battered metropolis to the debate over American disaster policy. That’s because the 14-mile-long island, home to only about 1,300 people, floods again and again, hurricane or no hurricane. Again and again, those homes are repaired and rebuilt, largely at the expense of U.S. taxpayers. The homes on Dauphin Island are among the 5 million that are covered by the National Flood Insurance Program. Founded in 1968 to make sure homeowners in flood-prone areas could get affordable insurance, the program ends up paying most residential flood insurance claims in the U.S. Partly as a result, development along coasts and riverbanks and in flood plains has exploded over the past 50 years.” Source: Bloomberg BusinessWeek, August 31, 2017, story by Christopher Flavelle)
[2] “Where Harvey is hitting hardest, 80 percent lack flood insurance” by Heather Long, August 29, 2017, The Washington Post
[3] IBID
[4] See Asaf Bernstein, Matthew Gustafson, and Ryan Lewis “Distaster on the Horizon: The Price Effect of Seal Level Rise” SRN-id3073842 working paper.
[5] See https://www.thebalance.com/hurricane-harvey-facts-damage-costs-4150087
[6] See https://www.usatoday.com/story/travel/2018/09/07/florida-welcomes-travelers-one-year-after– hurricane-irma/1220408002/
[7] IBID
[8] See “Listen: How a Houston investor buys and sells flooded homes” by Nancy Sarnoff, Jan.29, 2018, Houston Chronicle.
[9] IBID
[10] See Asaf Bernstein, Matthew Gustafson, and Ryan Lewis “Disaster on the Horizon: The Price Effect of Seal Level Rise” SRN-id3073842working paper.
[11] The deficit of outflows over insurance premiums has resulted in a $25 billion deficit as of Sept, 2017. See Why Federal Flood Program is SinkingDeeper into Debt: CBO Report: in the Insurance Journal, Sept. 5, 2017, at https://www.insurancejournal.com/news/national/20172/09/05/463227.htm